- Use of dangerous packages
- Use of deprecated code and packages
- Find data leakage or identifying potential issues through comments
- The use of undocumented packages or internal packages in your code
- Access to dangerous objects or objects that could leak useful information to an attacker
- Vulnerabilities such as SQL Injection as well as access to resources, the file system, exceptions and much more
We also check for all issues natively; i.e. direct use in PL/SQL code as well as check for most issues in strings as well so that if the code include dynamic PL/SQL or SQL then we can detect those cases as well.
The product is easy to use and I want to give a quick overview here. First open the application and go to the options screen and connect to the database. The user needs CREATE SESSION and also just SELECT ANY DICTIONARY for the application to work.
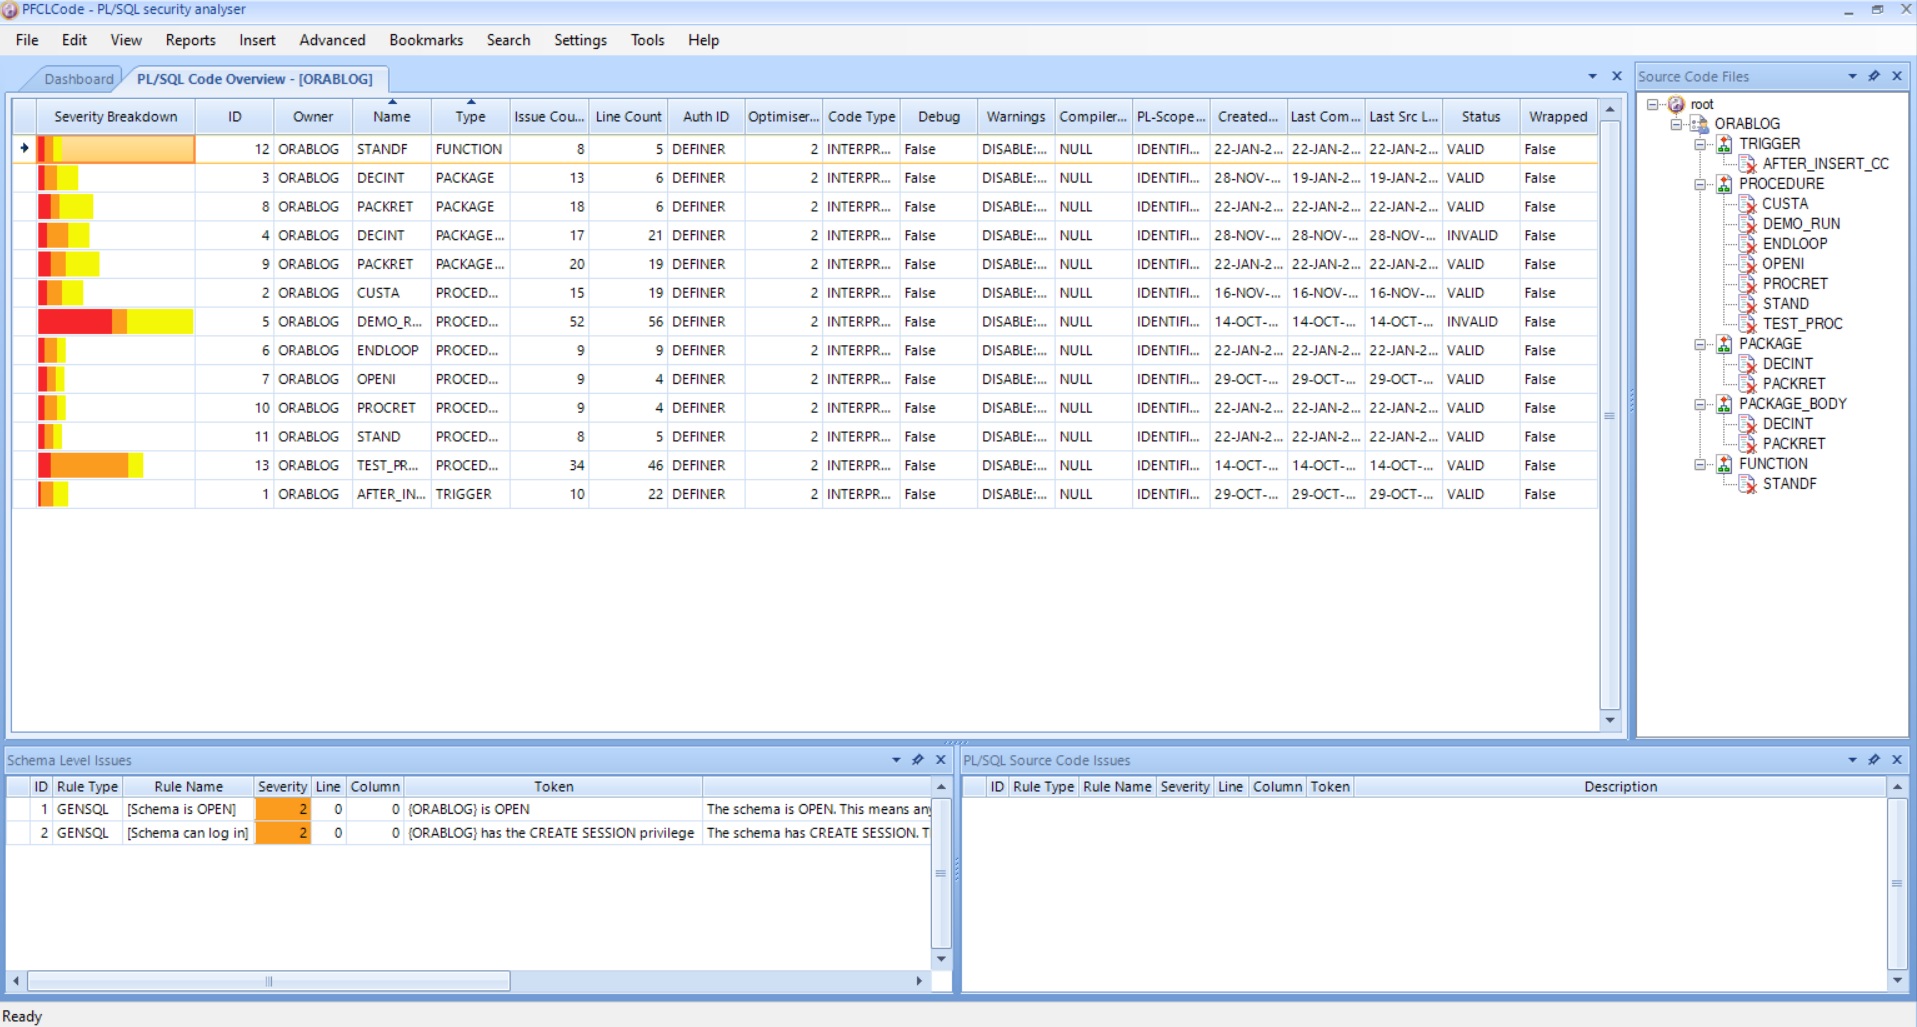
Once connected go to the "Schema" tab of the options dialog and click "refresh" to get a list of schemas. Once that has run select a schema to analyse. I am going to choose my ORABLOG schema. Next click OK and the schema is saved. Now in the main File Menu and click "Refresh Code List" and screen refreshes and lists all of the code in my ORABLOG schema:

The screen shows a list of all of the PL/SQL code in the ORABLOG schema (in this case) and the list shows to the left a small bar chart indicator in color of security issues located for each piece of PL/SQL. Red is most severe and Yellow the least. We have the numeric number of issues located, the name and type and whether its DEFINE or INVOKER and lots of details on when each piece of PL/SQL was created. On the right hand window we have a tree of each piece of PL/SQL ordered by type such as PROCEDURE.
The bottom left hand window shows schema wide issues not related to single piece of PL/SQL.
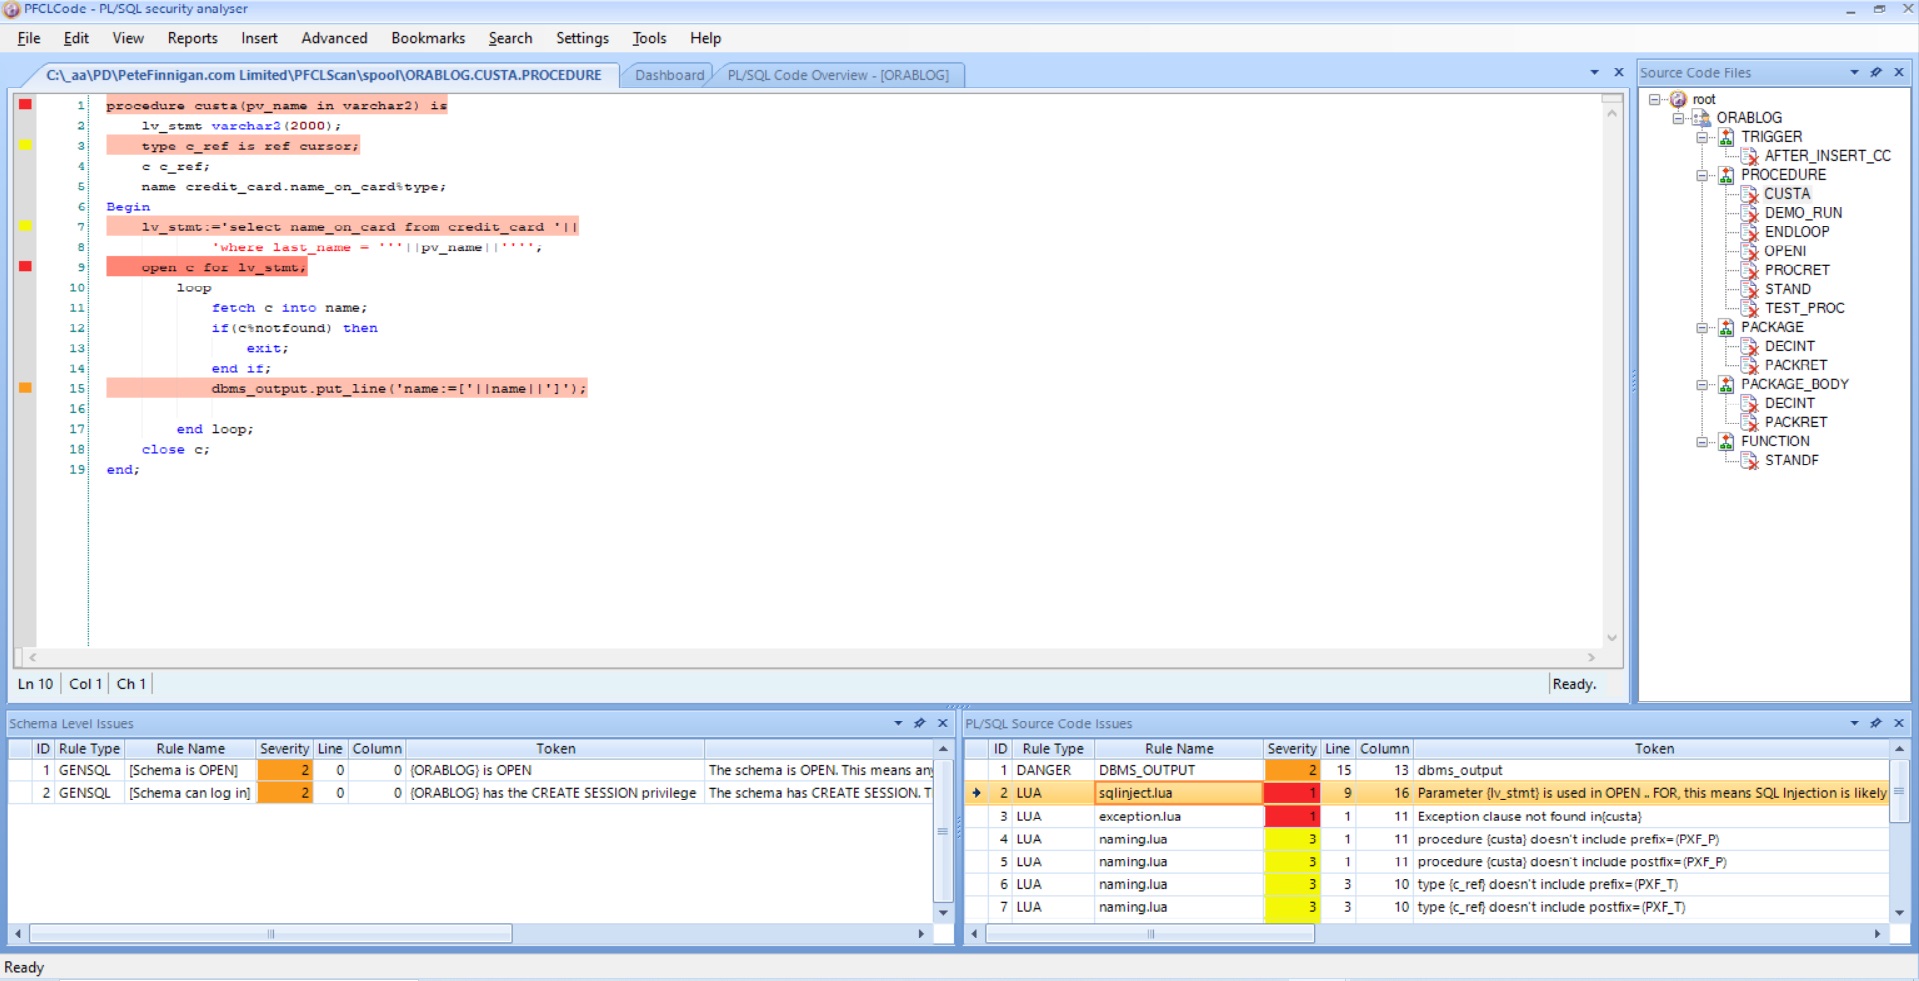
If we then click on a procedure such as CUSTA we can see the issues found for that procedure; or indeed any other piece of PL/SQL if we choose it. The screen changes:

The details for CUSTA issues are shown in the bottom right screen and if we click the SQL Injection issue we can see the PL/SQL source code and the issues that were located for this bug in the source code. All relevant issues are highlighted and the severity is shown as a coloured square to the left. If we hover over the SQL Injection issue:

We can see the pv_name is passed in in line 1, concatenated in line 8 and then used in the OPEN in line 9. There is no filtering or protection code so this is exploitable.
If you hover over each highlighted line you see more details of the issue or go to the table at the bottom right for details.
We can run a summary report across the whole schema or a detailed report that lists details of each issue found.
PFCLCode 2024 is very flexible and we have just shown a brief glimpse of it now. You can enable/disable checks to create a custom scan/investigation and you can also see progress in the dashboard by comparing any scans over a period of time to chart progress on fixing issues. The end user can create their own checks easily if needed and can edit ours.
The tool also allow a detailed view of granted permissions of each piece of PL/SQL and also of dependencies.
This is an easy to use tool that can be customised or used as-is and gives you a great overview of PL/SQL. Ask me for more details of PFCLCode 2024, ask for me to demonstrate the product live to you on webex or simply ask me if you would like to buy a license or if you would like us to audit your PL/SQL in your database for you.
#oracleace #sym_42 #secure #plsql #sqlinjection #static #code #analysis #securecode #codereview #pfclcode #pfclscan #audit #databreach


